
When working with GPU-enabled Azure virtual machines — such as those used for AI training, inference, or video rendering — you often need to monitor GPU utilization. While Azure Monitor provides basic metrics for CPU, memory, and disk, it doesn’t capture GPU-level data out of the box.
In this post, I’ll show you how to collect GPU metrics using nvidia-smi and Telegraf, and push them to Azure Monitor for analysis, alerting, or even autoscaling.
Contents
🧱 Use Case
Let’s say you’re running machine learning workloads on an Azure NC-series or ND-series VM, and want to:
- Monitor GPU usage
- Trigger autoscaling when GPU load is high or low
- Visualize GPU metrics in Azure Workbooks
- Set alerts when GPU memory is close to full
Azure Monitor doesn’t natively collect GPU metrics — but with Telegraf, you can.
🧰 Prerequisites
- An Azure VM with GPU (e.g. NC, ND, NV series)
- NVIDIA drivers and nvidia-smi installed
- Register resource provider “Microsoft.Insights” in your subscription
- Outbound internet access to Azure Monitor endpoints
- Root / Admin access to install Telegraf
🛠 Step-by-Step Guide
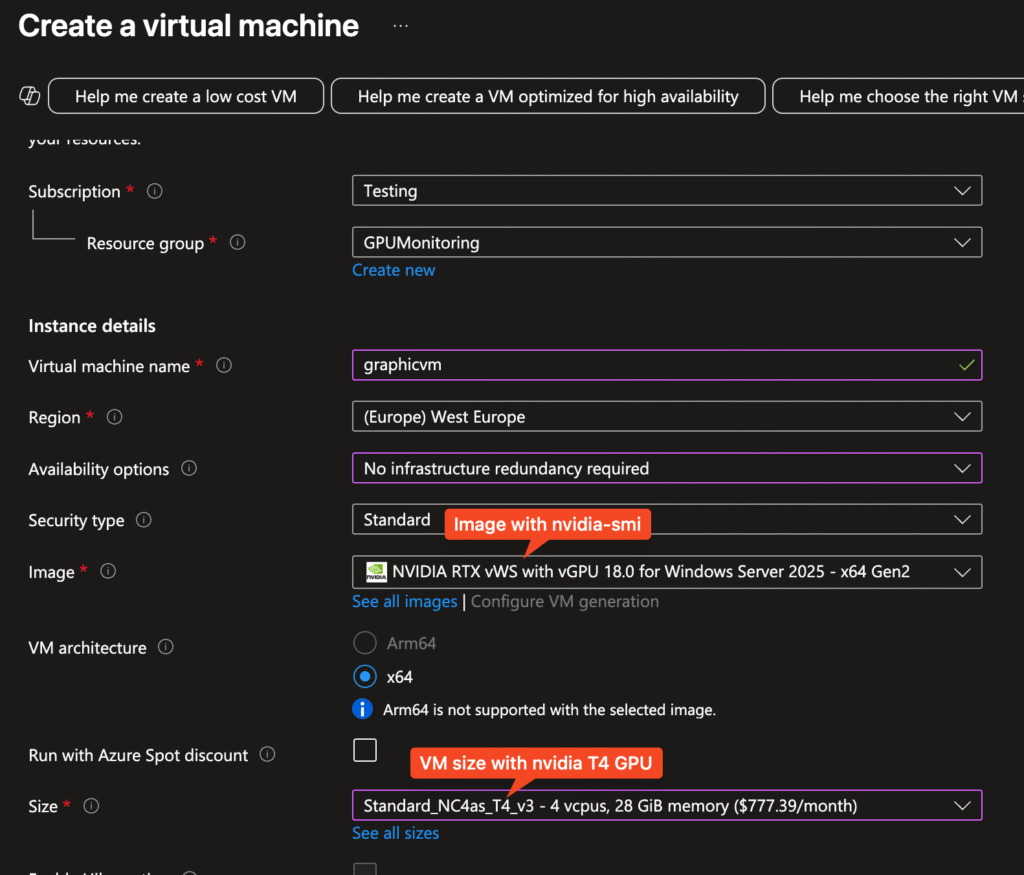
1. Create Virtual Machine
- Image with nvidia-smi preinstalled
- VM size with GPU
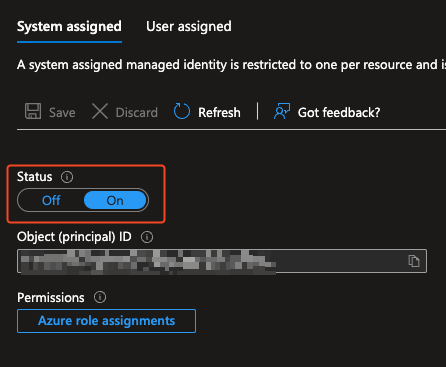
- Enable managed identity during deployment process
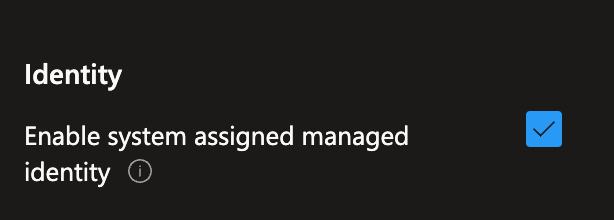
- or later at the existing VMs function blade
2. Install Telegraf
Before you install telegraf I would recommend to test if the nvidia-smi tool is available.
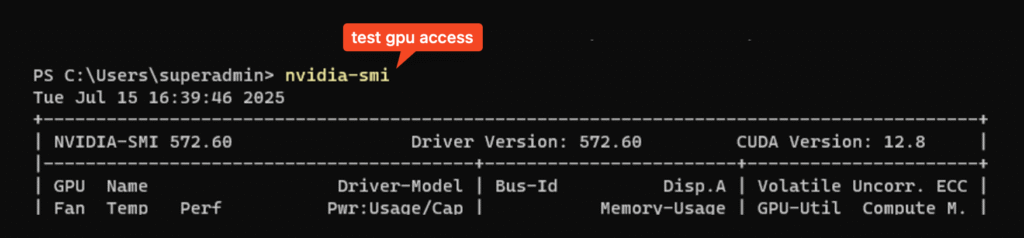
Windows
- Open PowerShell
- Execute the following commands
# Set the URL for the PowerShell script
$scriptUrl = "https://raw.githubusercontent.com/vinil-v/gpu-monitoring/refs/heads/main/scripts/gpumon-win.ps1"
# Download and execute the script
Invoke-WebRequest -Uri $scriptUrl -UseBasicParsing | Invoke-ExpressionThis automatically download and install telegraf and upload the data to the monitoring section.
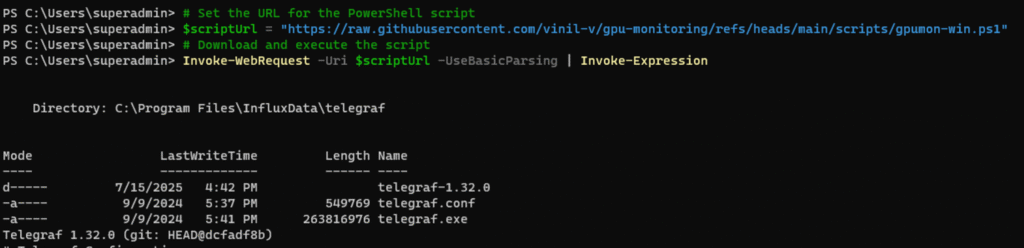
You can configure your telegraf.conf if you want specific data but by default GPU data will be sent to the Azure Metrics of your virtual machine. You can find the config file within the install path of telegraf.
To test your config use the following command:
telegraf --config <installpath>/telegraf.conf --testLinux
- Open your preferred shell
- Execute the following commands
wget -q https://raw.githubusercontent.com/vinil-v/gpu-monitoring/refs/heads/main/scripts/gpumon-setup.sh -O gpumon-setup.sh
chmod +x gpumon-setup.sh
./gpumon-setup.sh3. Review / Monitor
To receive the first data can take some time but should be found after 5-10 minutes.
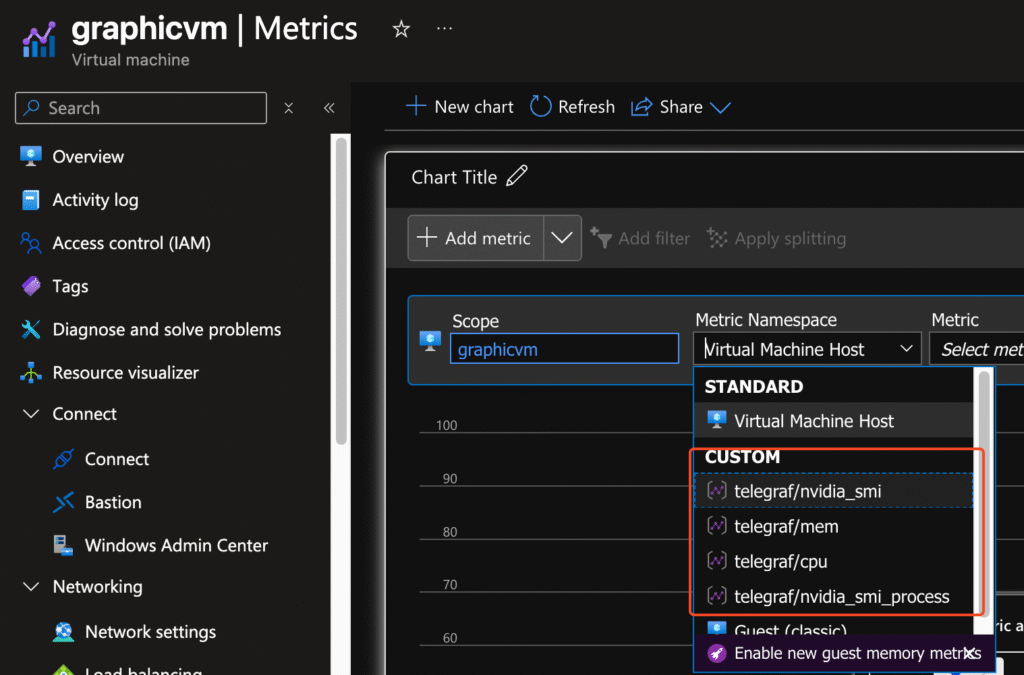
- Open the VM resource
- Select the Monitoring / Metrics blade
- Change the Metric Namespace to the namespace which you configured within your telegraf.conf
- By default its Telegraf/
- Select Telegraf/nvidia-smi for GPU metrics
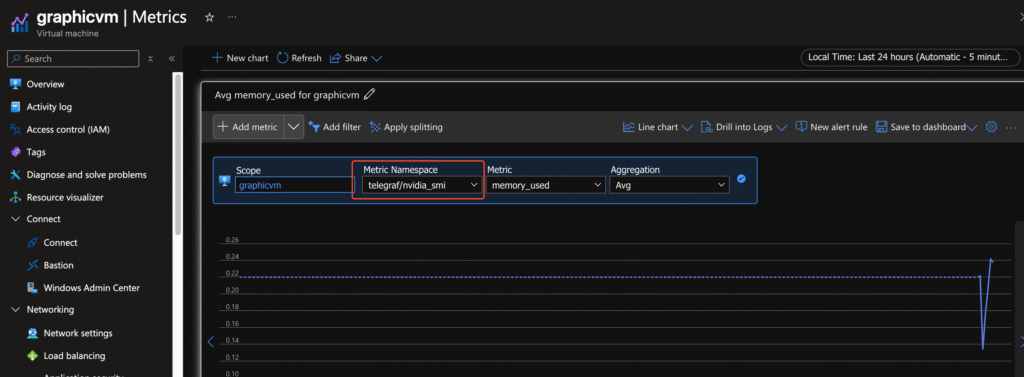
📈 Using Metrics in Azure
You can now:
- Visualize GPU load over time as described before
- Create alerts for thresholds (e.g., mem_used > 90%)
- Build scaling rules (via Azure VMSS or Automation)
🚀 Bonus: Autoscaling by GPU Usage
While Azure doesn’t offer native GPU-based autoscaling, you can build a solution by:
- Exporting GPU metrics to Log Analytics
- Creating alerts that trigger an Azure Automation Runbook
- That Runbook can scale your VMSS (or start/stop VMs)
Hint: Combine with Azure Monitor Alerts and Logic Apps for a low-code option.
You can also try to use the metrics data within your VMSS scaling setting.
📝 Summary
Telegraf provides a powerful workaround for collecting GPU metrics on Azure VMs. By leveraging nvidia-smi and Telegraf’s exec plugin, you can get deep GPU insights into Azure Monitor — enabling better dashboards, alerts, and even autoscaling decisions.