

A finding without a number you can trust is a guess. This is how TenantThrift measures what a VM really did, how it asks eleven questions in two queries, and why every euro in the report comes from your bill and not from a price list.
When the first admins tried TenantThrift, their first question was not about the security model. It was: “Where does this number come from?”
A report that says “save 312 euros a month” is only useful if the admin can explain that number to their boss. Advisor and Cost Management each show a part of the picture.
Neither can say: this VM costs you this much, it was on for that many hours, and here is why it could cost less. I wanted the scanner to answer exactly that, for every finding. This post walks through how it does it, in the order a scan runs.
What Advisor sees, and what it does not
Advisor is not a bad tool. Its right-size recommendation looks at CPU and memory over a window, and its reservation math is better than anything I would write by hand. Cost Management shows spend by resource, by tag and over time, from the same billing data I use. A team with time to go through both every month will find most of the same waste.
The gap is in the baseline. Advisor’s right-size advice does not know how many hours the machine was switched off. A VM that is idle while running and off half the month looks the same as one that burns all day.
And a resource that is covered by a reservation you already bought counts as a saving in every tool that uses list prices, even though deleting it saves nothing until the term ends. Both problems come from the same cause: the tools look at the resource, not at the bill.
A running VM tells you almost nothing
The power state of a VM is a snapshot. A machine that shows PowerState/running at 07:00 may have been off for 25 of the last 30 days. Another with the same state may not have been off once. Metrics cannot tell them apart either. A stopped VM sends no metrics at all, and “no data” looks exactly like “stopped” unless you know when it stopped.
The Activity Log knows. The scanner reads it per VM over the lookback window, 30 days by default, filtered by resourceId, and keeps only two operations with status Succeeded: microsoft.compute/virtualmachines/start/action and microsoft.compute/virtualmachines/deallocate/action. Sorted by time, they pair up into running intervals.
Two edge cases matter. If the first event in the window is a deallocate, the VM was already running when the window opened, so the interval starts at the window start.
If the last event is a start, it runs to the window end. Divide the summed hours by the window and you get average daily hours, and a utilization figure that reflects what the machine did, not what it reports this minute.
One more detail: the scan runs this for every VM that was running at any point in the window, not only for VMs that are running at scan time. An earlier version checked the current power state first. That made the scan time decide what gets checked: a virtual desktop fleet that boots at 07:00 was invisible to a 05:00 scan.
CPU comes on top, not instead. For every VM, the scan pulls the host metric Percentage CPU at one-hour granularity with both the Average and the Maximum aggregation. The average of the hourly averages has to be under 20 percent before a VM is a candidate for anything.
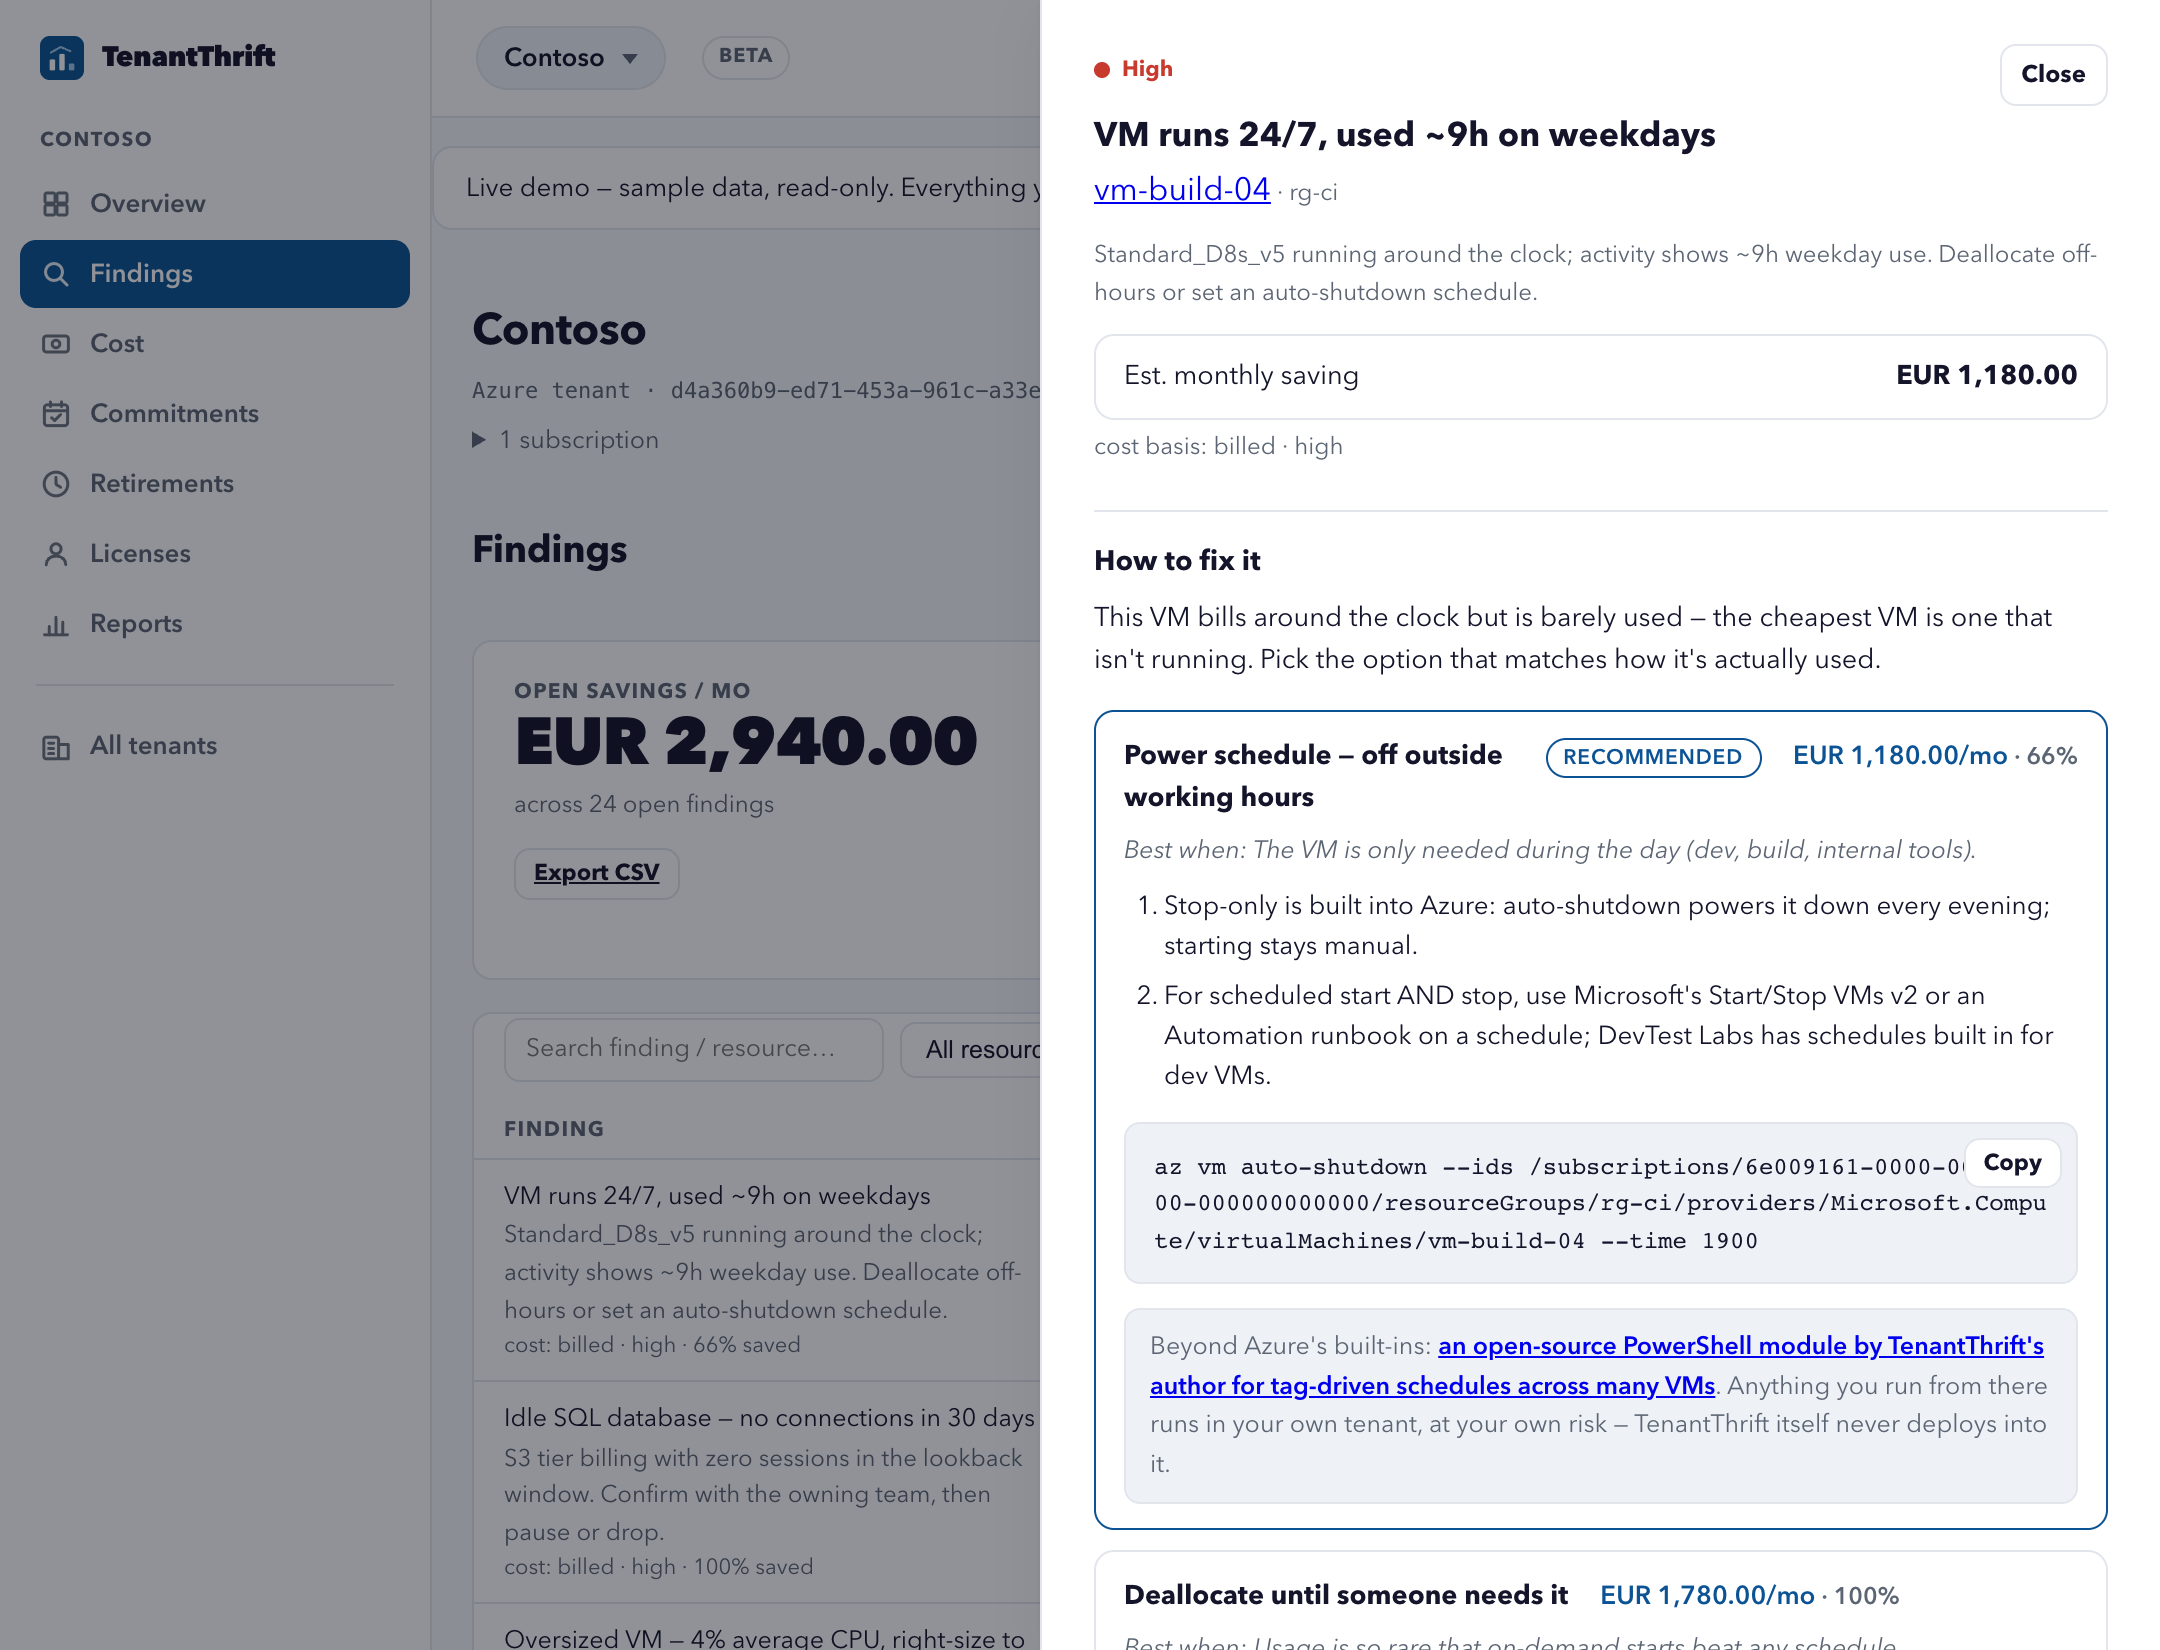
The 95th percentile of the hourly maximums decides what kind of candidate. Under 40 percent, a resize is on the table. Above it, the VM has real peaks and only a schedule makes sense. A schedule is offered only if the runtime reconstruction says the VM is on at least 90 percent of the time, and it carries neither a ttf-always-on tag nor an existing power runbook.
The resize target is the next smaller size in the same family that keeps the observed peak under roughly 70 percent of the new vCPU count. When both findings exist for one VM, the resize saving is scaled by the hours the schedule would already remove, so the two never add up to more than the machine costs.
If you have read my posts on tag-driven VM power schedules and the runbook that followed, you know where the schedule part came from. The scanner does not run schedules. It tells you which VMs would pay for one.
Eleven questions, two queries
Beyond VMs, most waste is a resource whose reason to exist is gone. A disk from a VM that was rebuilt. A public IP from a test that ended. A load balancer with no backend behind it. The scanner asks eleven questions of that kind through Azure Resource Graph, and the precision of each question is what keeps the findings list believable.
“Orphaned” has a definition per type, written in KQL against the resource’s own properties. A managed disk counts when diskState is Unattached and managedBy is empty. A public IP counts when it has neither an ipConfiguration nor a natGateway behind it.
A network interface counts when it hangs off neither a virtualMachine nor a privateEndpoint, which is the clause that keeps private endpoint NICs out of the list. A Standard load balancer with zero backend pools, a NAT gateway on no subnet, an App Service Plan with numberOfSites at zero outside the Free and Dynamic tiers, and a snapshot older than 30 days complete the set.
Those seven are whole-resource waste with a price that follows from the SKU, so they get a retail estimate on day one and the Cost Management actual as soon as one exists.
Four more are advisory, because the resource may be doing exactly its job: storage accounts with geo-redundancy, Log Analytics workspaces that keep data for more than 90 days, Bastion hosts, and VPN or ExpressRoute gateways. Those bill by the hour whether anyone uses them, so the finding states the cost and asks the question. It does not claim the resource is waste.
All eleven run as two combined queries instead of eleven calls, because Resource Graph allows at most six parts in one union. That is a throttling fix with a history. The first version ran seven separate queries, and the seventh, the NIC check, hit the per-tenant rate limit often enough to be the most common reason a scan came back incomplete.
Same machine, newer silicon
Right-sizing shrinks a VM. This check keeps it the same size and moves it a generation. A fully loaded D8s_v3 is as wrong to keep as an idle one if a D8s_v5 does the same work for less per hour, and in most regions it does.
The match is strict on purpose. The candidate has to share the vCPU count and CPU architecture from the SKU catalog, not from the name, because the number in older size names is not the core count: Standard_D3_v2 has four vCPUs.
It has to carry the same letters after the number, since a is AMD, p is ARM, d is a local disk and l is low memory, and two sizes that differ there are not the same machine.
It needs at least as much memory, a higher _v version, and a retail price at least 5 percent lower, or there is no finding. The old spelling is handled too: DS3_v2 and D4s_v5 are one family, because the old DS, FS, GS and LS series were “premium storage capable” before Azure wrote that as an s.
Two groups are skipped on purpose. A VM under a reservation or savings plan stays where it is, because the commitment was bought for the current size and moving it wastes that money. And a VM already flagged for a resize is not flagged twice; the smaller size is the bigger win.
The saving is the retail difference applied to the VM’s real runtime, marked as medium confidence, and the finding says when the target needs a Generation 2 image, because the scan cannot see the VM’s own Hyper-V generation.
For databases, idle is a connection count
Azure SQL gets the same treatment from Azure Monitor metrics, and Reader is enough for that. A database with a connection_successful total of zero over the 30-day window is idle, whatever its CPU graph looks like, because a CPU baseline alone could be system processes.
A database averaging under 20 percent cpu_percent with a 95th percentile of hourly maximums under 40 is over-provisioned, the same rule as for VMs, unless it is already on Basic, where there is nothing cheaper to go to.
Serverless databases, elastic pools and Synapse pools are left out. Auto-pause and pool-level billing make per-database utilization misleading, and a finding that could be wrong is worse than none. The metric queries are capped at the 150 most expensive databases, so if the cap bites, the cheap ones are the ones skipped. A step down is priced at 40 percent of the billed cost and says so.
For storage, idle is the last read
Storage accounts get the same treatment, and here idle means nobody read the data, not that there is a lot of it. The scan reads the account’s Transactions metric back in 30-day windows, because Azure quietly cuts a longer metrics query to about a month, and stops at the newest day with a read.
A download counts as a read. Listing a container or reading a blob’s properties does not. From that gap the scan picks a tier by Microsoft’s own minimum retention periods: Cool after 30 days without a read, Cold after 90.
It stays quiet below 100 GB, on any account that already has a lifecycle policy, and when the one-off write cost of moving the data would take more than a year to earn back. The saving comes from retail per-GB prices for the account’s redundancy and region, capped at what the account really billed.
Since April, Azure also has smart tier. It moves every blob between hot, cool and cold by its own last access, back to hot as soon as it is read, with no early-deletion fees, for a small monitoring fee per object. It needs a zone-redundant account. Blobs it already manages don’t count as hot capacity in the scan, so they never become a finding.
Priced from your bill, not from a price list
Each finding carries a monthly figure, and where that figure comes from decides whether anyone trusts the report. Mine come from Cost Management first. One query per subscription, ActualCost over the window grouped by ResourceId, gives the real cost of every resource. A second pass with AmortizedCost, grouped by ResourceId and PricingModel, tells me which resources are covered by a reservation or a savings plan.
That matters more than it sounds. Under actual cost a covered VM bills close to zero, so a naive scanner either prices it from the list and promises a saving that will never show up on the invoice, or hides it.
TenantThrift keeps the finding, prices it from the amortized figure, marks the confidence low and says in the guidance that the commitment is already paid for. The retail price API is the fallback for resources with no actuals at all, an orphaned disk created yesterday for instance, and the finding says so.
One query every 45 seconds
That pipeline has a war story. From late August, one tenant’s 07:00 UTC scan started coming back with USD 0.00 as this month’s spend. The cause was Cost Management throttling, and the detail is worth knowing if you build anything against that API.
The 429 response carries a header called x-ms-ratelimit-microsoft.costmanagement-clienttype-retry-after, with values between 20 and 45 seconds, next to x-ms-ratelimit-remaining-microsoft.costmanagement-clienttype-requests: DefaultQuota:0. I measured it with curl on a throttled subscription. After waiting 40 seconds, exactly one query went through, and the next one six seconds later was throttled again. For that client type the budget is about one query per 45-second window.
Three queries per scan with a 4, 8 and 16 second backoff could never all pass, and the old code did not even read that header. Now every throttle header is read and the longest wins, queries from one process are spaced two seconds apart, the last good cost snapshot per subscription is cached, and a scan that still gets throttled says so instead of storing a zero.
When Advisor says dollars and the report says euros
Advisor’s own cost recommendations ride along as advisory findings, with two corrections. Advisor emits the same recommendation once per lookback window, 7, 30 and 60 days, so a reserved-instance suggestion arrives three times and is collapsed to one.
And it quotes savings in its own currency, usually dollars, while the scan totals in the billing currency. A report once summed “EUR 49.25” for a figure Azure had stated in USD. Now a recommendation in a foreign currency stays in the list, unpriced, and its text says what Advisor estimated and in what.
The rule behind all of it
Measure first, price from the bill second, and name the source third. Every finding in the report says where its number comes from: Cost Management actual, Cost Management amortized, retail list price, or a rule of thumb like the 40 percent for a SQL step down. A number with a source survives the meeting. A number without one gets the report closed.
Where the numbers can still be wrong
The Activity Log keeps 90 days, and a VM that never started or stopped inside the window has no runtime events, so the scan falls back to its current state and says so. The retail fallback is a list price, not your price, and an Enterprise Agreement discount makes it too high.
Storage metrics only reach back 93 days, so the scan never recommends Archive, which has a 180-day minimum. Whether data is really keep-forever is your call.
The generation check cannot see whether a VM boots as Generation 1 or 2, so it warns instead of deciding. And every figure is an estimated potential, not a guaranteed reduction. If you find a number that does not match your bill, I want to hear about it. That is how the 45-second rule got into the code.
I write about Azure identity and security at simonvedder.com. Building something similar, or think I got a detail wrong? Drop me a line.
Leave a Reply